Our tools
Our tools
To support the ecological transition of citizens, businesses and regions, BASIC develops decision-making tools.
Here are some of the tools currently offered by BASIC:
- Parcel, a simulator to help relocalize food production
- The Distribution of value observatory, in international value chains
Parcel
As the first-ever online food footprint simulator, Parcel is a simple, fun and free web-based tool that enables you to assess, for a given territory, the agricultural land required to feed the population with locally-sourced products, as well as the agricultural jobs and ecological impacts associated with possible changes in agricultural production methods and/or diets. Parcel was developed by BASIC in partnership with the French National Federation of Organic Agriculture (Fédération nationale d’agriculture biologique) and the NGO Terre de liens to support food and agricultural transition and relocation projects on a regional, departmental, or even local scale.
Parcel can be used to simulate the effects of scenarios such as increasing the proportion of organic farming, reducing the proportion of food of animal origin, or even reducing waste.
Highly customizable, Parcel can be used by citizens wishing to know their region’s capacity for food transition, as well as by elected representatives wishing to know whether local agricultural production will enable them to reach the target of 20% organic products in school cafeterias.
Parcel is available free of charge here.
We are currently developing a version of Parcel adapted to Wallonia, in partnership with the Sytra team at the Catholic University of Louvain, Belgium.
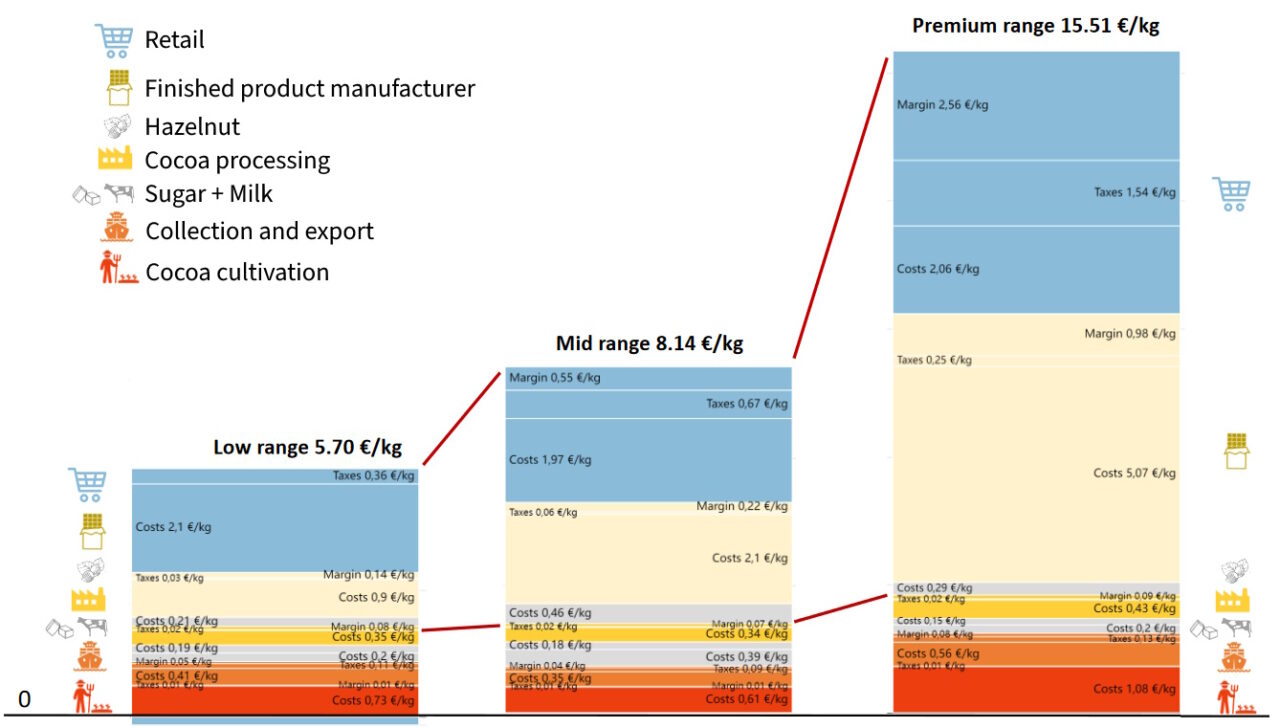
Distribution of value observatory
BASIC has developed a tool that shows the distribution of value for typical products in several sectors, from their production, sometimes in faraway countries, to their consumption on European markets. This interactive tool shows how much is earned by each link in the production chain – for example, of a top-of-the-range chocolate bar in Germany or a lipstick containing mica extracted in India.
This tool presents the costs, taxes and net margins of the various links in the value chain, making it possible to visualize who is remunerated and how much as part of the final price paid by consumers.
In addition to this informed breakdown over a specific year, the tool offers the possibility to simulate different situations. Users can experiment with the impact of a rise in input costs or a fall in export prices on the breakdown of costs, taxes and net margin for the selected product.